From Action Comics #1 to early Silver Age – What’s Worth Slabbing in Poor Condition?

This article is Part 4 in a continuing series. Part 1Part 2, and Part 3 are linked.  In previous articles, it was established that books like Amazing Fantasy #15 (1962), Incredible Hulk #1 (1962), and Fantastic Four #1 (1961) – which are submitted to CGC in all conditions – provide a better representation of what conditions might be expected to exist for other comic books of the same age, even if they are never submitted to CGC.  Additionally, the percentage of restored books on the CGC Census may be representative of the time period, reflecting attempts to improve a comic’s appearance over the past six decades.

Read the latest article on GPAnalysis.com.

The Early 1960s Beyond Amazing Fantasy #15 (And How Much Restoration?)

In previous articles, it was seen that there is a significant financial incentive to submit even the lowest grade copies of certain books like Amazing Fantasy #15, and the CGC Census grade distributions for Amazing Fantasy #15 are likely to be a good representation of all existing copies of not only Amazing Fantasy #15 but perhaps all 1962 comic books as well. Looking beyond 1962, Fantastic Four #1 (1961) and Avengers #1 (1963) enhance the evidence for the grade distributions of comics books from early 1960s in different ways.  How many of these books are CGC 9.0 today? Perhaps just 1%, and the answer to the restoration question might surprise many collectors who never touched their raw books but can’t be too sure about their books’ previous owners 50+ years ago.

Read the full article at GPAnalysis.com

Overstreet Comic Book Price Guide #50 – Market Report

(from OSPG #50, pages 129-130, published September 2020, written in December 2019)

Greg Holland
SlabData.com
Certified and encapsulated comic books (“slabs”) are only a small percentage of all comic books in existence, but the slabbed comic market represents a much larger percentage of total dollars spent annually. Certified Guaranty Company (CGC) opened to the public in 2000.  As this book is printed, it is now 2020 and with CGC’s permission, I have been compiling the CGC census into a searchable database online for almost the entire time. 4,816,652 comic books were reported as professionally graded and encapsulated according to the official CGC census in the first 20 years of CGC (as of mid-December 2019). This 20-year total is 3,936,750 universal grades, 772,851 signature series, 58,187 restored, and 48,864 qualified grades. Those 4,816,652 slabs are for 195,695 different comic books. Most comic books submitted to CGC have been graded fewer than ten times.  More than 50,000 comics have been CGC graded only once. Nearly 100,000 comics have been CGC graded no more than three times. At the other end of the list, ten comic books have been graded at least 10,000 times each. Amazing Spider-Man #300 became the first comic to pass 20,000 CGC graded copies, followed by New Mutants #98, Wolverine Limited Series #1, Marvel Super Heroes Secret Wars #8, Amazing Spider-Man #361, Uncanny X-Men #266, Incredible Hulk #181, Spawn #1, Amazing Spider-Man #129, and Amazing Spider-Man #252 in 10th place.  Nine of these ten most submitted books are from Marvel along with Spawn #1 from Image Comics.  The most submitted comic from D.C. Comics is Batman: The Killing Joke in 18th place with 6,615 copies on the CGC census.  The Top 100 most-submitted comics have 99 comics from Marvel (84), D.C. Comics (11), or Image (4). The only Top 100 book by another publisher is Rai #0 (1992) from Valiant Comics in 69th place (3,852 copies graded), rising from 101st place a year ago and perhaps nearing the Top 50 by the time of this publication.  The Top 100 most-submitted books to CGC represent 553,534 copies on the CGC census, or 11.5% of all slabs.  While the CGC Census shows nearly 200,000 different comic books graded almost 5,000,000 times, one in nine slabs comes from a short list of just 100 comics (see cgcdata.com for the full list). 

CGC Census Counts by Comic Decade (as of mid-December 2019):

  • 1930s = 8,889 (0.2%) –
  • 1940s = 153,500 (3.2%) –
  • 1950s = 157,137 (3.3%) –
  • 1960s = 733,763 (15.2%) –
  • 1970s = 784,295 (16.3%) –
  • 1980s = 733,428 (15.2%) –
  • 1990s = 558,110 (11.6%) –
  • 2000s = 555,015 (11.5%) –
  • 2010s = 1,121,381 (23.3%) –
  • Others = 11,134 (0.2%) – (“Others” includes undated books)
  • Total = 4,816,652.

CGC counts, totals, and averages are not a random sample of the whole comic book market. Comics which are sent to CGC have often been selected by the submitter for exceptional qualities of high grade condition, high market value, or both. By definition, the average raw comic is unlikely to be exceptional.  Another important note is that comics which have few copies on the CGC census are not necessarily rare. When a comic book has little market value, even if it is very old, there is little reason to pay for third-party professional grading and encapsulation. Comics which appear uncommon on the CGC census may be extremely common and of little value in the market. Since most comic books in existence are worth much less than the cost of CGC grading, we should not expect to find many low-valued comics in the CGC census.  The opposite is also true, the higher the value of a comic book, we should expect that more of the existing copies will be graded.  There will be copies of every valuable comic book which are never sent to CGC, particularly when the owners have no desire to sell the books, but the number of $10,000+ comic books changing hands (publicly) without first being CGC graded is rapidly decreasing.  A review of more than 2,500 sales for $10,000+ comic books at Heritage Auctions shows 99% are “already slabbed” comics. Understanding that the market for $10,000+ comic books has overwhelmingly become slabbed comics; it becomes important to recognize that the CGC census for the highest valued comics now provides significant data points about the existing copies remaining.  Expert estimates for the number of surviving copies of Action Comics #1 (1938) and Detective Comics #27 (1939) generally suggest 100 to 200 copies exist.  With more than one-third (and perhaps as high as half) of those top two key issue estimates already appearing on the CGC Census, it may be possible to estimate the remaining copies of other $10,000+ comic books as well.  With all conditions of Amazing Fantasy #15 now worth $10,000+ and the CGC census showing 3,203 copies graded, perhaps an estimate of 6,500 to 10,000 copies is accurate if about one-third to half are already graded.  If previous estimates for surviving copies of Amazing Fantasy #15 have been much lower or much higher, then perhaps CGC is providing the industry with a better method for calculating estimates on books of such high values.  Estimates for surviving copies of books of lower values are certainly not reflected as clearly by the CGC census, however, it may be possible to understand surviving copy estimates between books of similar value even if only 1% have been CGC graded.  For example, if any two books have been approximately the same value for the past 20 years of CGC grading, and one book has twice the number of CGC graded copies on the CGC census, then it may be fair to estimate that twice as many copies exist.  Using simple supply-and-demand logic, when the demand values are identical then the different counts of CGC graded copies are most likely related to supply.  Sure, there are always other factors and we may never know exactly how many copies remain for books, but it may actually be true that there are twice as many copies when the values are similar and the CGC counts are double. We will never understand everything about the comic book market, but perhaps 2020 will be the year we take the time to really review what can be known (hindsight is 20/20, after all).  Whether we’re talking about the seemingly never-ending debates of first appearances, or the estimates for surviving copies of the highest-valued comics, the decades of census information, sales information, and expert estimates really are the best sources we have in 2020.  CGC has been a focus in this market report, but when another grading company makes their census available and gives permission, they will be included in future reports.  While some collectors proclaim that all surviving copy or print run estimates are a permanent mystery, maybe other collectors like me are thinking that nearly 5,000,000 comics graded over 20 years represents a sample large enough to teach us some things we haven’t known before.  Some say the goal in the market is ABC – Always Be Closing (the sale), but I say always be learning (the market).  More information is available at slabdata.com and more detailed CGC census analysis can be performed at cgcdata.com.

What can the CGC Census tell us about all those ungraded comics?

The CGC Census generally reflects a strong portion of the best copies known, a lighter portion of the existing mid-grade copies, and usually a very small portion of the existing low grade copies. A temptation exists to interpret the CGC Census as representative of both graded and ungraded copies, but the more focused evidence within the CGC Census for specific comics worth grading in all conditions may be applied more broadly to all comic books of the same age. Starting with the CGC Census grades for Amazing Fantasy #15 – a comic absolutely worth submitting to CGC in all conditions.

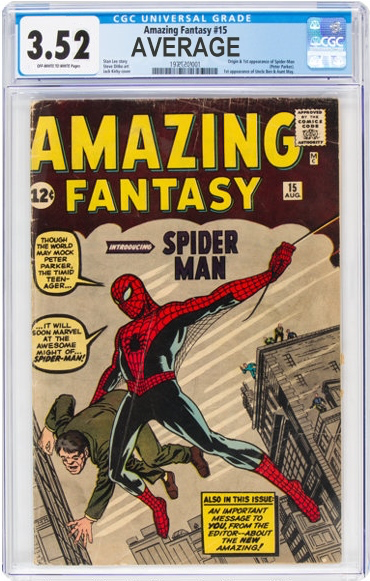
The CGC universal average grade is 3.52 for Amazing Fantasy #15

This article provides evidence for the likely grades for all other surviving comic books from 1962, even if the vast majority of those comics are never submitted to CGC. Read the full article from August 27, 2020, on GPAnalysis.com here.

How far do CGC average grades drop as comics get older?

The CGC Census reflects which comic books and how many copies of each have been submitted to CGC for grading and encapsulation for over 20 years. There are 204,534 individual comics with 5,210,195 copies CGC graded according to the June 30, 2020, CGC Census. With very few exceptions, newly-released comic books have always been sold without any certification or encapsulation, and billions of comic books printed through the decades still exist as those same “raw” comics in personal collections and dealer inventories. It is tempting to use the CGC Census as a view into the existing quantities and surviving conditions of comic books, but it is important to understand what the CGC Census can and cannot reveal. One question to ask is how far the CGC average grades drop as comics get older? Greg Holland compares CGC average universal grades with the ages and numbers of submissions for all comic books 1930s to present.

CGC universal average grades by decade

Read the full article from July 28, 2020, on GPAnalysis.com here.

Amazing Spider-Man #300 Direct and Newsstand

Since CGC began grading comic books in 2000, the most submitted book is Amazing Spider-Man #300 (1988). More than 22,000 copies of ASM #300 have been graded as of May 12, 2020.

The current CGC totals and grades for ASM #300 can be found here:
http://www.cgcdata.com/cgc/search/isolateid/273

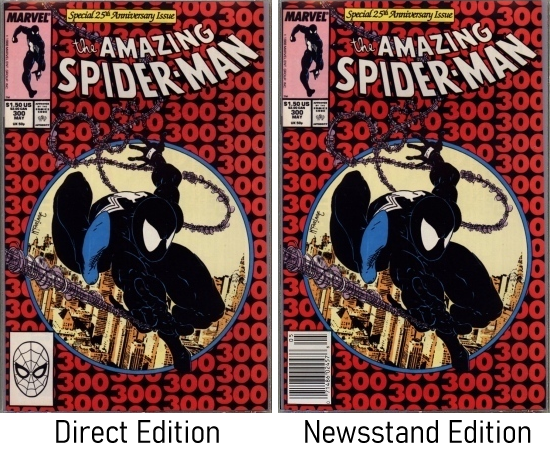
The Direct Edition of ASM #300 was sold to comic book retailers via direct market distributors, having a Spider-Man head on the front cover in the white box on the lower left. Direct editions were sold as non-refundable, in exchange for a discounted price for the retailer. Many dealers ordered extra copies to keep their back issue inventory supplied for years to come.

The Newsstand Edition of ASM #300 with the UPC barcode on the front cover. Newsstand editions of comic books, along with monthly magazines, were most often supplied to locations such as grocery stores, drug stores, gas stations, sandwich shops, and other non-retailer comic shops. Unsold copies of newsstand editions were returned after a month or two for credit, and presumably scrapped, shredded, recycled, or trashed.

More information about Newsstand Editions can be found at Newsstand101.com

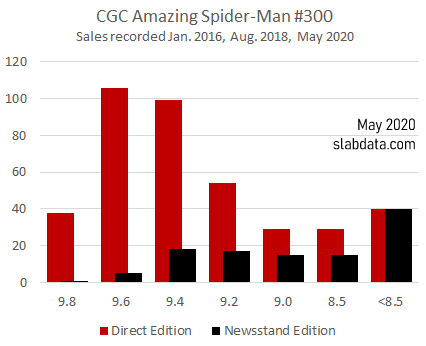
As of May 2020, CGC does not differentiate between the Direct Edition and the Newsstand Edition of ASM #300. An evaluation of over 500 copies of ASM #300 in the Ebay.com marketplace on three different dates (January 2016, August 2018, and May 2020) gives a view into the CGC ratios between Direct Edition and Newsstand Edition for ASM #300.

CGC gradeDirectNewsstand
9.8381
9.61065
9.49918
9.25417
9.02915
8.52915
<8.54040
TOTAL (506 copies)
Average CGC Grade
395
9.14
111
8.36

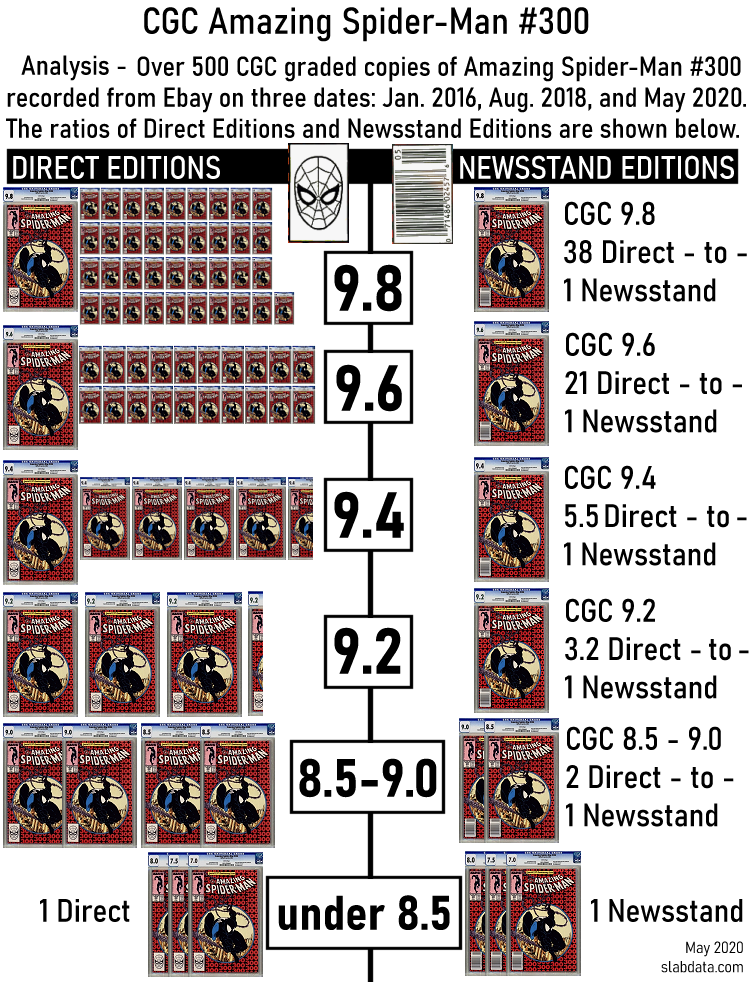
Another view, showing the ratios as X-to-1 for each CGC graded is presented in the graphic below:

The average CGC grade in the recorded sales for Direct Edition ASM #300 was CGC 9.14, while the average CGC grade for Newsstand Edition ASM #300 was 8.36.

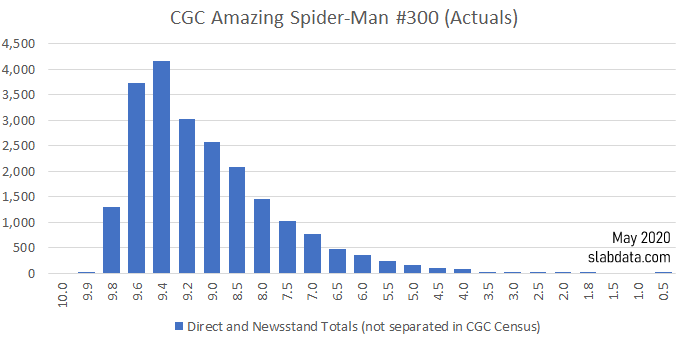
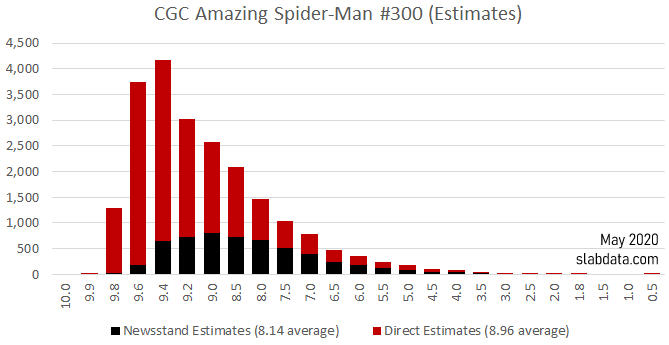
The CGC Census for ASM #300 can be shown with counts for each grade, even though the Direct and Newsstand editions are not separated. The average grade (Universal and Signature Series) is 8.76.

Applying these market ratio estimates to the full CGC Census numbers (22,000+ copies) for ASM #300 results in the following:

The lower average grade estimates for the full CGC Census (Newsstand 8.14, Direct 8.96) are attributed to the fact that lower grades do not appear in the Ebay.com market as often as the higher grades, relative to their CGC Census totals. Overall, the average grade remains 8.76 for all copies on the census.

Most Common Books In A Grade

The most submitted books to CGC (as of April 21, 2020) are:  Amazing Spider-Man #300 (22,136 copies), New Mutants #98 (18,620 copies), Wolverine Limited Series #1 (15,400), with Amazing Spider-Man #361 (15,107) soon to jump ahead of Wolverine into 3rd place.

BUT… if you focus on a particular label… let’s say CGC 9.8… which book would be the most common in that particular grade?  It’s not ASM #300… it’s not New Mutants #98… and it’s not the other two books at the top of the list.  The most universal CGC 9.8 belongs to Spawn #1.

Here are the most common books for EACH of the CGC universal grades:

CGC 10 – Batman: Damned 1 (309 copies at CGC 10)
CGC 9.9 – Batman: Damned 1 (649 copies at CGC 9.9)
CGC 9.8 – Spawn 1 (5,425 copies at CGC 9.8)
CGC 9.6 – Amazing Spider-Man 361 (4,814 copies at CGC 9.6)
CGC 9.4 – Amazing Spider-Man 300 (3,314 copies at CGC 9.4)
CGC 9.2 – Amazing Spider-Man 300 (2,440 copies at CGC 9.2)
CGC 9.0 – Amazing Spider-Man 300 (2,096 copies at CGC 9.0)
CGC 8.5 – Amazing Spider-Man 300 (1,697 copies at CGC 8.5)
CGC 8.0 – Amazing Spider-Man 300 (1,189 copies at CGC 8.0)
CGC 7.5 – Incredible Hulk 181 (945 copies at CGC 7.5)
CGC 7.0 – Amazing Spider-Man 129 (875 copies at CGC 7.0)
CGC 6.5 – Incredible Hulk 181 (749 copies at CGC 6.5)
CGC 6.0 – Amazing Spider-Man 129 (631 copies at CGC 6.0)
CGC 5.5 – Incredible Hulk 181 (538 copies at CGC 5.5)
CGC 5.0 – Incredible Hulk 181 (594 copies at CGC 5.0)
CGC 4.5 – Incredible Hulk 181 (440 copies at CGC 4.5)
CGC 4.0 – Fantastic Four 48 (412 copies at CGC 4.0)
CGC 3.5 – X-Men 1 (317 copies at CGC 3.5)
CGC 3.0 – X-Men 1 (378 copies at CGC 3.0)
CGC 2.5 – X-Men 1 (277 copies at CGC 2.5)
CGC 2.0 – X-Men 1 (224 copies at CGC 2.0)
CGC 1.8 – X-Men 1 (155 copies at CGC 1.8)
CGC 1.5 – Amazing Spider-Man 1 (121 copies at CGC 1.5)
CGC 1.0 – Amazing Spider-Man 1 (129 copies at CGC 1.0)
CGC 0.5 – X-Men 1 (122 copies at CGC 0.5)

CGC Census – Walking Through Time 2000-2020

An interactive data visualization for the first 20 years of CGC grading (2000-2020).

Submissions to CGC by comic in a visualization that steps through the first 20 years of CGC grading. The decades and publishers at the top of the graphic can be selected or de-selected by clicking on the name (such as 1990s Marvel). See how the list changes when you remove the most popular submission decades. The graphic is on a loop, and will restart by itself after 2020 has displayed a few seconds. Use the pause/play button on the bottom left to start and stop the graphic. You can pause and jump directly to any year by clicking on the year in the timeline at the bottom. Then play again to restart.

For the source of this graphic, go to
https://public.flourish.studio/visualisation/1764850/

For a much “taller” version of the graphic (showing 50 comics), go to
https://public.flourish.studio/visualisation/1769671/

CGC Census: Grades For The 1960s

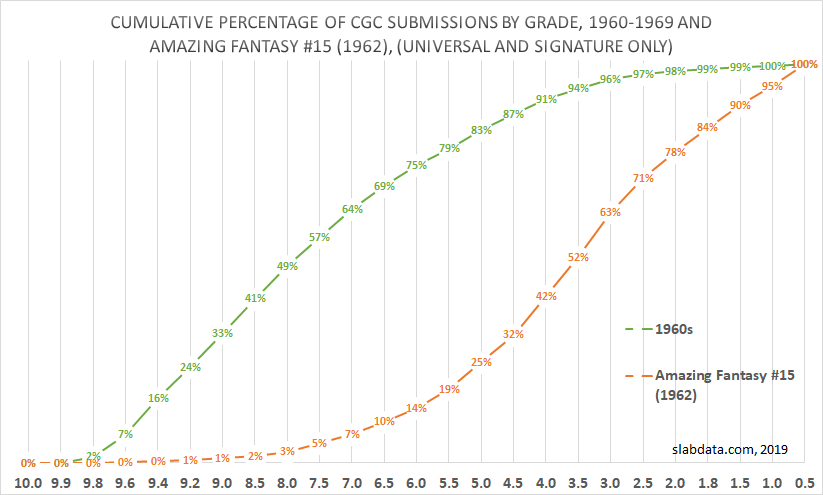
Continuing the thoughts of a previous post, let’s take a moment to focus on the 1960s. Comparing the CGC Census grades (cumulative percentages for Universal and Signature Series), we see a distinct difference between the decade and the most valuable comic book in the decade, Amazing Fantasy #15 (1962).

These differences are due to two major factors, first, that books submitted to CGC must (generally) be worth the cost of CGC grading, otherwise, there is no financial reason to submit a book to CGC. As a result, the books submitted to CGC from 1960-1969 have primarily been higher grade copies than average, since value increases as the condition increases. Secondly, the entire decade of the 1960s has been combined to create the 1960s line on the graphic, while Amazing Fantasy #15 represents only a single issue from the single year of 1962.

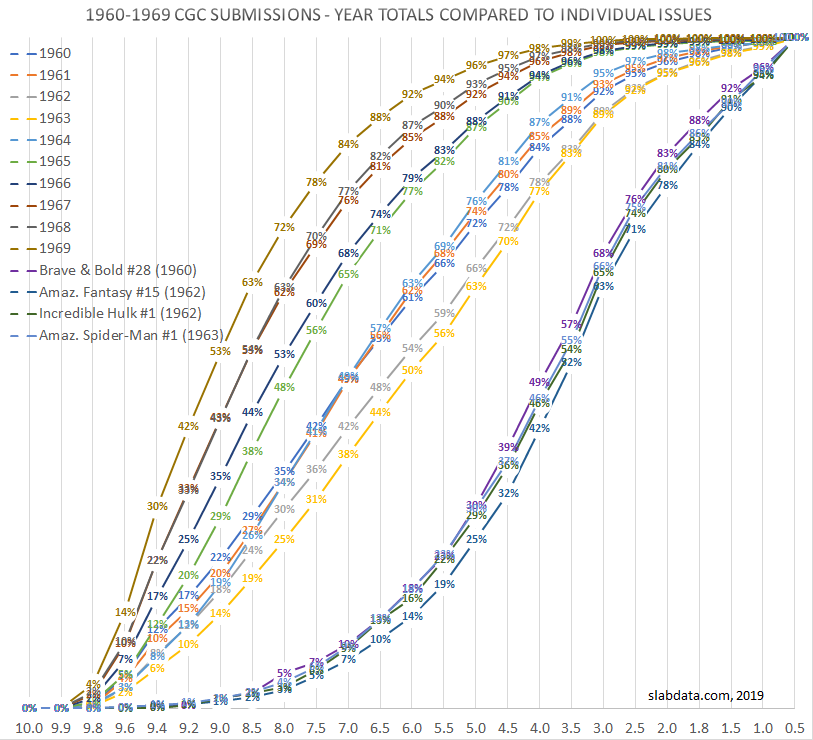
To remedy these differences, the graphic below represents each year of the 1960s separately, and shows additional comics besides Amazing Fantasy #15 from 1962.

CGC Submissions (Universal and Signature Series) for each year of the 1960s, with selected comics from the early 1960s.

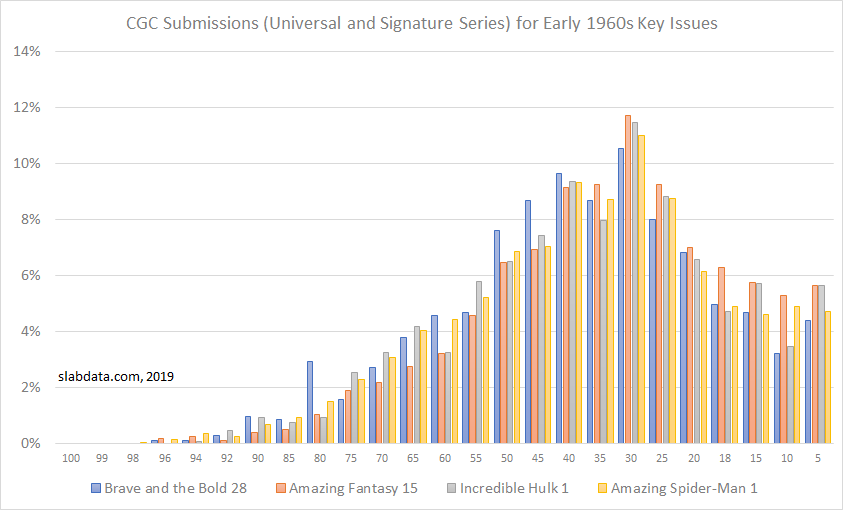
This may be the first time that the consistency of CGC grade percentages has been isolated for major comics of the early 1960s. Because each of these comic books (Brave & The Bold #28, Amazing Fantasy #15, Incredible Hulk #1, and Amazing Spider-Man #1) is generally worth submitting to CGC in all possible grades, these books generally reflect the full populations for each book (percentage-wise), despite every copy not being CGC graded.

While every copy of a comic book is unlikely to be sent to CGC for grading, those comics which are valuable in all grades, including valuable for the difference between CGC 0.5 and CGC 1.0, will be reflected on the CGC Census as a better sample of the total population of comics for that year, or possibly, for several years in that range.

It should be surprising that the four books selected are so closely aligned in their CGC grade percentages, and that they are so far from the percentages of the years they represent. It is possible that these grades may be generally applicable for all comic books of this era, CGC graded or not, even for other comic books of the same age which may have little value.

CGC Submissions (Universal and Signature Series) for Early 1960s Key Issues – Brave & The Bold #28, Amazing Fantasy #15, Incredible Hulk #1, and Amazing Spider-Man #1

Apart from more CGC 8.0 Brave and the Bold #28 than what might be expected (perhaps due to regrading), is it possible that this general distribution could be applicable to all comics from the early 1960s?

Perhaps time will tell…

CGC Census: Grades by Decade

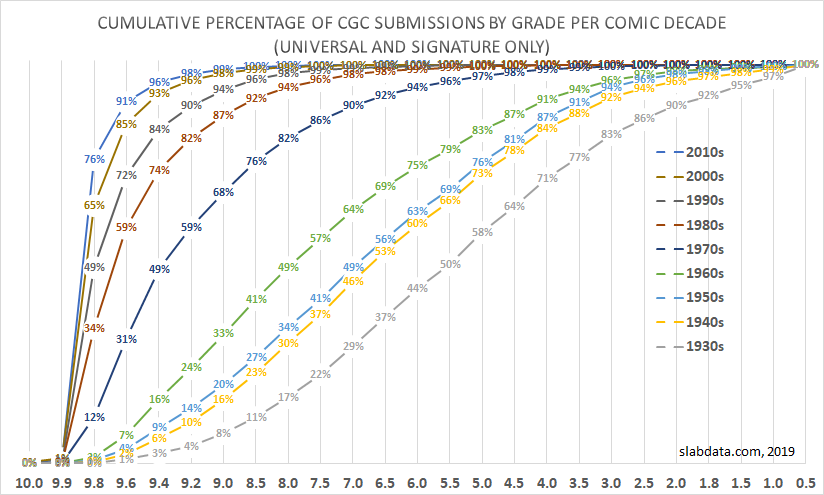
After nearly 20 years of CGC grading (2000-2019), it is possible to see the percentages of grades assigned to comic books broken out by the ages of the comics (decades).

Cumulative Percentage of CGC Submissions By Grade Per Comic Decade (Universal and Signature only)

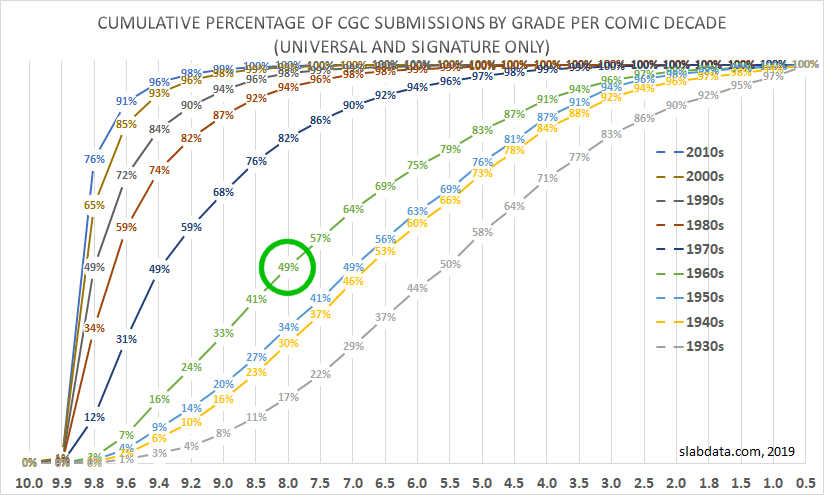
The graphic above shows that the percentage of higher grades decrease as the comic books get older, as we would expect, however the graphic does not accurately represent all comic books in existence. For example, judging from the numbers shown, it could be assumed that 49% of comic books from the 1960s are CGC 8.0 or higher.

However, assuming that 49% of comic books from the 1960s are CGC 8.0 or higher is not even close to accurate. What the 49% represents is that 49% of comic books from the 1960s which have been graded by CGC have been 8.0 or higher. The key factor is that these books have been graded by CGC, that is, someone selected the books to be graded, prepared the books for grading, and paid the costs of grading. There are many comic books for which CGC grading is hard to justify, due to the costs of CGC grading.

While any comic book can be graded by CGC, it is hard to understand why someone might pay $27, not including the costs of shipping, to have CGC grade and encapsulate comics which do not sell for at least $27. Most comic books do not sell for $27, including comic books from the 1960s, due to the condition of the comic or the lack of demand in the marketplace.

In order to better understand the condition of comic books from the 1960s, it would make sense to evaluate the CGC grades for comic books where all copies (regardless of condition) are worth submitting to CGC for grading. This scenario is most likely to occur with the highest valued comic books, where the difference in prices between even a CGC 0.5 and a CGC 1.0 are higher than the cost of CGC grading. For those comic books, the percentages of each CGC grade are a better representation (sample) of all copies in existence, rather than just the comics that are “CGC-worthy”.

Comparison of Cumulative Percentage of CGC Submissions By Grade for the 1960s against Amazing Fantasy #15 (1962)

The difference is staggering. Rather than expecting 49% of comic books from the 1960s to be CGC 8.0 or higher, it can be seen that only 3% of copies of Amazing Fantasy #15 (1962) have been CGC 8.0 or higher. While we should not expect every comic book from the 1960s to have the same percentages, it is reasonable to expect that Marvel comics from 1962 would be quite similar to the grades for Amazing Fantasy #15, if all copies (regardless of condition) were submitted to CGC for grading. Rather than expect 8.0 to be the average condition for comics from the 1960s, it might be safer to expect to find half of all copies no better than 3.5 to 4.0.

While there is no way to know the percentages for each grade for every comic book in existence, we can get a better representation of what may be in existence by studying the CGC Census for comic books which are “CGC-worthy” (that is, justifiable of the CGC costs, regardless of condition) as the representative for comics of the same age with similar distributions and histories. Future articles on this website will examine other comics for which every copy is worthy of submitting to CGC, regardless of condition.

One thing to note: Because these are percentages, this entire article makes no mention or estimate for the actual number of each comic still in existence. This evaluation is reflecting the percentages of each grade, whether there are 100 or 1,000,000 copies.

Overstreet Market Report – December 2018 OSPG #49

The following post contains the Overstreet Market Report supplied to the Overstreet Comic Book Price Guide #49, published in July 2019.

GREG HOLLAND

slabdata.com

Despite the increasing attention placed upon slabs (third party professionally graded and encapsulated comic books), it is the raw (ungraded, non-slabbed) comic books which remain the overwhelming majority of comic books in existence, available for purchase, and sold each year. Price guides such as this one remain extremely important to the market by providing accurate listings and values for raw comics, if for no other reason than the immense size of the raw comic market this guide serves. Slabs represent a very small percentage of all comic books in existence, however, the slabbed comic market represents a much larger percentage of total dollars spent annually, particularly for the highest valued (and highest publicity key issue) comic books in each decade. The largest of the professional grading companies for comic books has been Certified Guaranty Company (CGC) since opening to the public in 2000. With CGC permission, I have been compiling the CGC census into a searchable database online since 2003. If any other grading companies also make their census information available and give permission, they will be included in future reports. While there are billions of comic books in existence, 4,161,087 comic books were reported as having been professionally graded and encapsulated according to the official CGC census by mid-December 2018. The counts break out as: 3,405,568 universal grades, 659,200 signature series, 53,488 restored, and 42,831 qualified grades. Those 4,161,087 slabs are for 179,409 different comic books, seeming to show that the average comic book sent to CGC has been graded 23 times. In fact, more than 50,000 different comics have been graded only once, more than half of the 179,409 comics have been graded three times or less, and more than 129,000 (72%) of the 179,409 have been graded fewer than ten times. Only 4% of comic books sent to CGC have been graded at least 100 times. The nine most submitted comic books to date have been graded at least 10,000 times. This might seem like a very high number of copies graded, but even 10,000 is only 10% if the print run was 100,000 comics.  The comics in the top most submitted were printed in multiple hundreds of thousands of copies. The most often CGC graded comic book is Amazing Spider-Man #300 with more than 18,000 copies graded, followed by New Mutants #98, and Wolverine Limited Series #1. The next five are Marvel Super Heroes Secret Wars #8, Uncanny X-Men #266, Incredible Hulk #181, Amazing Spider-Man #361, and Amazing Spider-Man #129. In ninth place is Spawn #1, followed by Amazing Spider-Man #252 in tenth, which is likely to exceed 10,000 graded copies by the time of this publication.  Nine of the top ten most submitted books are from Marvel, plus Spawn #1 from Image Comics.  The top most submitted comic from D.C. Comics is Batman: The Killing Joke at 17th most submitted with 5,770 copies on the CGC census.  All the Top 100 most-submitted comics are from Marvel (85), D.C. Comics (11), or Image (4). The first book represented by another publisher is Rai #0 (1992) from Valiant Comics at position #101 (2,512 copies graded).  The Top 100 most-submitted books to CGC represent 476,015 copies on the CGC census, which is 11.4% of all CGC graded comics.  The Top 1% of comics submitted to CGC (1,794 different comics) represent 1,715,163 slabs, or 41% of all slabs. 

CGC Census Counts by Comic Decade (as of mid-December 2018):

1930s = 8,254 (0.2%) –

1940s = 138,426 (3.3%) –

1950s = 135,854 (3.3%) –

1960s = 656,900 (15.8%) –

1970s = 694,187 (16.7%) –

1980s = 639,429 (15.4%) –

1990s = 472,865 (11.4%) –

2000s = 519,093 (12.5%) –

2010s = 893,984 (21.5%) –

Others = 2,095 (<0.1%) –

Total = 4,161,087.

Drawing broad conclusions using the CGC census information is more problematic than simply calculating the numbers. CGC counts, totals, and averages do not necessarily represent a sample of the whole comic book market. Comics which are sent to CGC have often been selected by the submitter for exceptional qualities of high grade condition, high market value, or both. By definition, the average raw comic is unlikely to be exceptional.  Another important note is that comics which have few copies on the CGC census are not necessarily rare. When a comic book has little market value, even if it is very old, there is little reason to pay for third-party professional grading and encapsulation. Comics which appear uncommon on the CGC census may be extremely common and of little value in the market. One common phrase often used with CGC graded comics is the phrase “highest graded”. According to the CGC census, the highest graded copy is rarely alone. The potential buyer for a highest graded copy should check to see if the copy is still the highest graded because more copies may be graded at any time. The buyer should also know if the highest graded copy is one of one, one of ten, or one of hundreds at the same grade. Over 25% of all CGC graded comics are also the “highest graded” for that issue. More than 1,000,000 CGC graded comics are technically the “highest graded” while fewer than 50,000 are the “single highest graded” copy with at least one lower graded copy on the CGC census. Everyone should be aware that the phrase “highest graded” rarely means “single highest graded”. Additionally, any premiums paid for the single highest graded copy of a comic book should be considered carefully, since another copy at the same grade or higher could potentially be graded tomorrow. There is also quite a bit of debate and mystery associated with the highest possible CGC grades of CGC 9.9 and CGC 10.  At the time of this writing, CGC had assigned the CGC 9.9 grade to 15,432 comics (about 1 out of every 270 comics graded) and assigned the CGC 10 grade to 3,503 comics (about 1 out of every 1,188 comics graded).  The CGC 9.9 and CGC 10 grades are overwhelmingly associated with recently-printed comic books.  80% of CGC 9.9 and 86% of CGC 10 books were printed since CGC opened to the public in 2000.  A high percentage of the remaining CGC 9.9 and CGC 10 comics were printed in the 1990s with chromium wraparound covers. It is common to point to the CGC 9.9 and CGC 10 grades (and their corresponding high prices in the market) as examples of extremes, even extreme absurdities, but it should be recognized that CGC 9.9 and CGC 10 are extremely infrequent, particularly for comics printed in the 1990s and earlier which do not feature chromium covers.  The oldest CGC 10 comic book is Kolynos Presents the White Guard #1 (1949), which was a promotional comic book for a toothpaste company. The oldest standard comic book graded CGC 10 is a copy of Thor #156 (1968). The oldest comic book graded CGC 9.9 is a copy of Zip Comics #7 (1940).  All three of the oldest CGC 9.9 and CGC 10 books listed above were graded by CGC more than 15 years ago.  For key issue comics, it is nearly universally-accepted that the three biggest superheroes in the comic book industry are Superman, Batman, and Spider-Man, so it is worth noting that CGC has graded 69 copies of Action Comics #1 (1st Superman, 1938), 68 copies of Detective Comics #27 (1st Batman, 1939), and 3,061 copies of Amazing Fantasy #15 (1st Spider-Man, 1962).  If there were unreported CGC resubmissions for copies of these (or any other) comic books, then the CGC census numbers are too high. While this means that the CGC census has errors, the actual number of CGC slabs in the market (and available for purchase) is always equal to the number reported or is even lower.  More information like this market report is available at slabdata.com, and more detailed CGC census analysis can be performed at cgcdata.com.
Why is this slab more valuable than that one?

This post is taken from the CGC Board where user “Hollywood1892” asked:

QUESTION: Why is NYX #3 More Valuable than New Mutants #87 and New Mutants #98?

ANSWER:

Supply and demand determine value” is easy to say, and it’s the right answer …but… I like putting actual numbers to those concepts. 

SUPPLY (CGC 9.8 universal counts):

New Mutants #87 = 1,454 

New Mutants #98 = 2,759

NYX #3 = 1,505

VALUE (CGC 9.8 universal sales average):

New Mutants #87 = $425

New Mutants #98 = $750

NYX #3 = $915

DEMAND (supply times value):

New Mutants #87 = 1,454 x $425 = $617,950

New Mutants #98 = 2,759 x $750 = $2,069,250

NYX #3 = 1,505 x $915 = $1,377,075

CONCLUSION:

NYX #3 is basically halfway between New Mutants #87 and New Mutants #98 in DEMAND (as defined above).  The individual prices for each copy are less important, because the supplies are different.  Put the two together (SUPPLY x VALUE) and you get something (DEMAND) that’s possible to compare across books.

There are plenty of objections to this simple calculation, such as:

What about the CGC 9.6, CGC 9.4, etc.?

What about all the additional raw copies that have never been sent to CGC?

What about the higher grades?

What about the fact that these books had different numbers of copies printed in the first place, regardless of how many are on the CGC Census?

What about more copies being sent to CGC all the time?

These objections are valid, but the original question reflected only one variable (Value) while the answer given here includes three variables (Value, Supply, Demand). It’s always possible to add more variables to any equation, but we quickly realize that both Pareto and Occam are more famous than we are for good reason…

They didn’t spend all day asking “But what about these 14 other things?”

Where is the cut-off for “High Grade”?

If we’re discussing where the cut-off for “high grade” comics would be, in terms of condition, then there’s an answer based on the eye appeal of a comic.  It’s hard to see how a comic book rated at least Very Fine to Near Mint (VF/NM, or 9.0 on the 10 scale) wouldn’t be a “high grade” comic according to its appearance.

However, if the comic was produced last week and was a 9.0 condition, it would actually be “low grade” relative to the quantities which would be available at 9.4 (Near Mint) and above.

It would be hard to say that 9.6 or higher is required for a comic to be “high grade” (regardless of age) since there are older comics which may not even exist in grades above 8.0, particularly comics from the beginning of the superhero genre of the late 1930s to 1940s.

Using the decades of the comics as a guide, and offering possible cut-off points as a percentage of CGC graded copies (Universal and Signature), the following chart provides some extra information to the discussion.

There isn’t a definite conclusion to be made from the numbers, and there isn’t a definite answer to when comics no longer “look high grade” from an appearance standpoint (being in the eye of the beholder), but more than 3,000,000 CGC graded comics were analyzed to produce the chart above. That’s at least a little more information than we had before.

Highest Graded! But is it Single Highest Graded?

There is a natural desire to celebrate owning (or offering for sale) the “Highest Graded” copy of a comic book, which can be determined by looking at the CGC Census.

There is also a difference between the “Single Highest Graded” copy of a comic book and owning one of the “Highest Graded” copies (are there 2 or 200?) graded (so far).

Here’s a breakdown of “Highest Graded” for Universal and Signature Series CGC graded comics, as of October 3, 2017 CGC Census:

172,631 different comic books on the CGC Census, 3,546,449 CGC graded comics, and 3,475,440 are Universal or Signature Series (about 71,000 are either Restored or Qualified grades).

There are 1,004,156 CGC graded comics which are technically “Highest Graded” – that is, 28.3% of ALL CGC graded comics, more than 1-in-4 CGC Graded comics are also “Highest Graded” copies.

There are 95,628 “Single Highest Graded” copies, and over half of them are also the “Only Graded Copy”… so 54,811 are single highest without any “competition”.

That leaves 40,817 “Single Highest Graded” copies which have at least one other lower graded copy on the CGC Census. That means 4% (about 1-in-25) of the 1,004,156 comics that can claim to be “Highest Graded” on the census are also “Single Highest Graded” with at least two copies graded.

Here is the breakdown of the 95,628 “Single Highest Graded” copies:

54,811 are “single highest” and “only graded copy”

13,101 are “single highest” and “one of two copies graded”

6,108 are “single highest” and “one of three copies graded”

3,668 are “single highest” and “one of four copies graded”

9,330 are “single highest” with 5 to 10 copies graded

4,165 are “single highest” with 11 to 20 copies graded

2,775 are “single highest” with 21 to 50 copies graded

797 are “single highest” with 51 to 100 copies graded

804 are “single highest” with 101 to 1,000 copies graded

69 are “single highest” with more than 1,000 copies graded

The “Single Highest Grade” in terms of highest total Universal and Signature Series copies graded are:

 
Rank as of Oct. 3, 2017 Universal and Signature CGC Submissions Highest CGC Grade Comic
1 13,301 10 New Mutants 98 (1991)
2 8,772 9.9 Incredible Hulk 181 (1974)
3 7,556 10 Wolverine 1 (1988)
4 4,026 10 Web of Spider-Man 1 (1985)
5 3,792 9.9 X-Men 141 (1981)
6 3,411 9.9 Uncanny X-Men 142 (1981)
7 3,067 9.9 Avengers Annual 10 (1981)
8 3,008 9.9 New Teen Titans 2 (1980)
9 2,577 9.9 Batman: The Dark Knight Returns 1 (1986)
10 2,573 9.8 Amazing Spider-Man 1 (1963)
11 2,541 9.9 X-Force 2 (1991)
12 2,516 9.8 Amazing Spider-Man 14 (1964)
13 2,222 9.9 X-Factor 24 (1988)
14 1,936 9.9 Incredible Hulk 271 (1982)
15 1,930 9.9 The Marvels Project 1 Sketch Cover (2009)
16 1,874 9.9 Walking Dead 19 (2005)
17 1,858 9.9 Uncanny X-Men 244 (1989)
18 1,842 9.9 X-Men 140 (1980)
19 1,815 10 Amazing Spider-Man 363 (1992)
20 1,781 10 Amazing Spider-Man 316 (1989)
21 1,770 10 Deadpool 1 (1993)
22 1,767 10 Rai 0 (1992)
23 1,767 9.9 Shazam 1 (1973)
24 1,752 9.9 Iron Man and Sub-Mariner 1 (1968)
25 1,699 9.9 Batman 404 (1987)


Most Popular Comic Book Publishers Submitted to CGC

The most often submitted publishers to CGC, as of the January 17, 2017 CGC Census.  To date, at least one submission has been made for 2,476 different publishers.

58% of all submissions are Marvel comic books, and 20% are D.C. Comics.  Marvel can also claim another 0.4% each for Timely and Atlas titles, while D.C. also adds 0.6% for Vertigo titles.

Image Comics has also published as Skybound and Top Cow, to total more than 6% of CGC submissions.  Only two other publishers total at least 1% of CGC submissions, Dell Publishing and Valiant Comics.

1930s Comics – Popular Submissions to CGC from 2000 to 2015

Popular comic book submissions to CGC from 2000 to 2015 are fairly consistent, with the same comics appearing most years, but a few surprises do appear as recent events such as movie releases, character re-introductions, and television series impact the demand for their CGC graded key issues.

1930s: View a three-year “Top 10” and an overall ranking for comic books from 1930 to 1939 in the chart below (enlarge), or as a printable PDF.

1940s Comics – Popular Submissions to CGC from 2000 to 2015

Popular comic book submissions to CGC from 2000 to 2015 are fairly consistent, with the same comics appearing most years, but a few surprises do appear as recent events such as movie releases, character re-introductions, and television series impact the demand for their CGC graded key issues.

1940s: View the annual “Top 10” and an overall ranking for comic books from 1940 to 1949 in the chart below (enlarge), or as a printable PDF.

1950s Comics – Popular Submissions to CGC from 2000 to 2015

Popular comic book submissions to CGC from 2000 to 2015 are fairly consistent, with the same comics appearing most years, but a few surprises do appear as recent events such as movie releases, character re-introductions, and television series impact the demand for their CGC graded key issues.

1950s: View the annual “Top 10” and an overall ranking for comic books from 1950 to 1959 in the chart below (enlarge), or as a printable PDF.